
As a beginner in data science or machine learning, it always adds a cushion if you already know some basic and most often used terminologies. You might feel intimidated at start hearing all those fancy AI/ML terms used by people everywhere. This is one of the posts that gives you a basic overview of the most used fundamental concepts in machine learning.
1. Cross Validation
- k-fold cross validation approach: (k-1 training blocks with 1 testing block)
- Leave One Out Cross Validation approach: (each data point is considered as a block)
- Cross validation is also useful to determine the best hyperparameters for the model being trained.
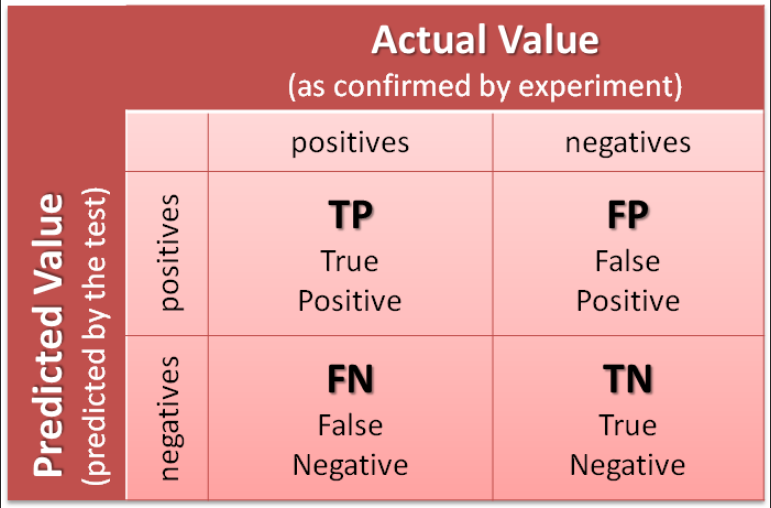
2. Confusion Matrix
- Helps in summarizing the performance of the testing data on our trained model
- Rows in the confusion matrix correspond to the predicted data from the model and Columns correspond to the actual output of the data

3. Sensitivity & Specificity
- Accuracy
- ACC is the ratio of correct predictions to the total number of data points
Accuracy = (True Positive + True Negative) / TotalACC = 1 - ERR, where ERR is the Error Rate
- Sensitivity (Recall or True Positive Rate)
- The number of correct positive predictions divided by the total number of positives
- The best sensitivity is 1.0, whereas the worst is 0.0
Sensitivity = True Positive / (True Positive + False Negatives)
- Specificity (True Negative Rate)
- The number of correct negative predictions divided by the total number of negatives
- The best specificity is 1.0, whereas the worst is 0.0
Specificity = True Negative / (True Negative + False Postive)
- Precision (Positive Predictive Value)
- Precision (PREC) is the ratio of correct positive predictions to the total number of positive predictions
Precision = True Positive / (True Positive + False Postive)
4. Bias & Variance
Bias
- High bias can lead models to underfit the data
- For example: A straight line generally underfits a practically complicated training dataset (or model) as it has high bias and cannot curve according to the data available. This is the problem faced by Linear Regression while fitting complicated models
Variance
- On the other hand, a model can overfit the training data and can lead to very high variance
- Generally, complicated high dimension models lead to overfitting a relatively small training dataset
- Adding a small amount of bias to the model while training on the data can significantly reduce its resulting variance. Such technique is also called Regularization
NOTE: A model that has low bias & low variance generally performs well in real datasets.
- Three commonly used methods for finding the sweet spot between simple and complicated models are:
- Regularization
- Boosting
- Bagging
5. AUC - ROC
- A performance visualization for classification problems at various threshold settings.
- ROC is a probability curve and AUC represents degree or measure of separability
- Higher the AUC, better the model is at predicting classes as it tells how the model is capable of distinguishing between classes
ROC is plotted with TPR (y-axis) against FPR (x-axis); where
FPR = 1- Specificity- ROC with AUC = 1, i.e. a model having ideal classification ability
- ROC with AUC = 0.7, i.e. a model with slightly better classification ability than random guess
- ROC with AUC = 0.5, i.e. a model that does no better than as a random guess


